


InSight Lander
Interior Exploration using Seismic Investigations, Geodesy and Heat Transport (InSight)
Type
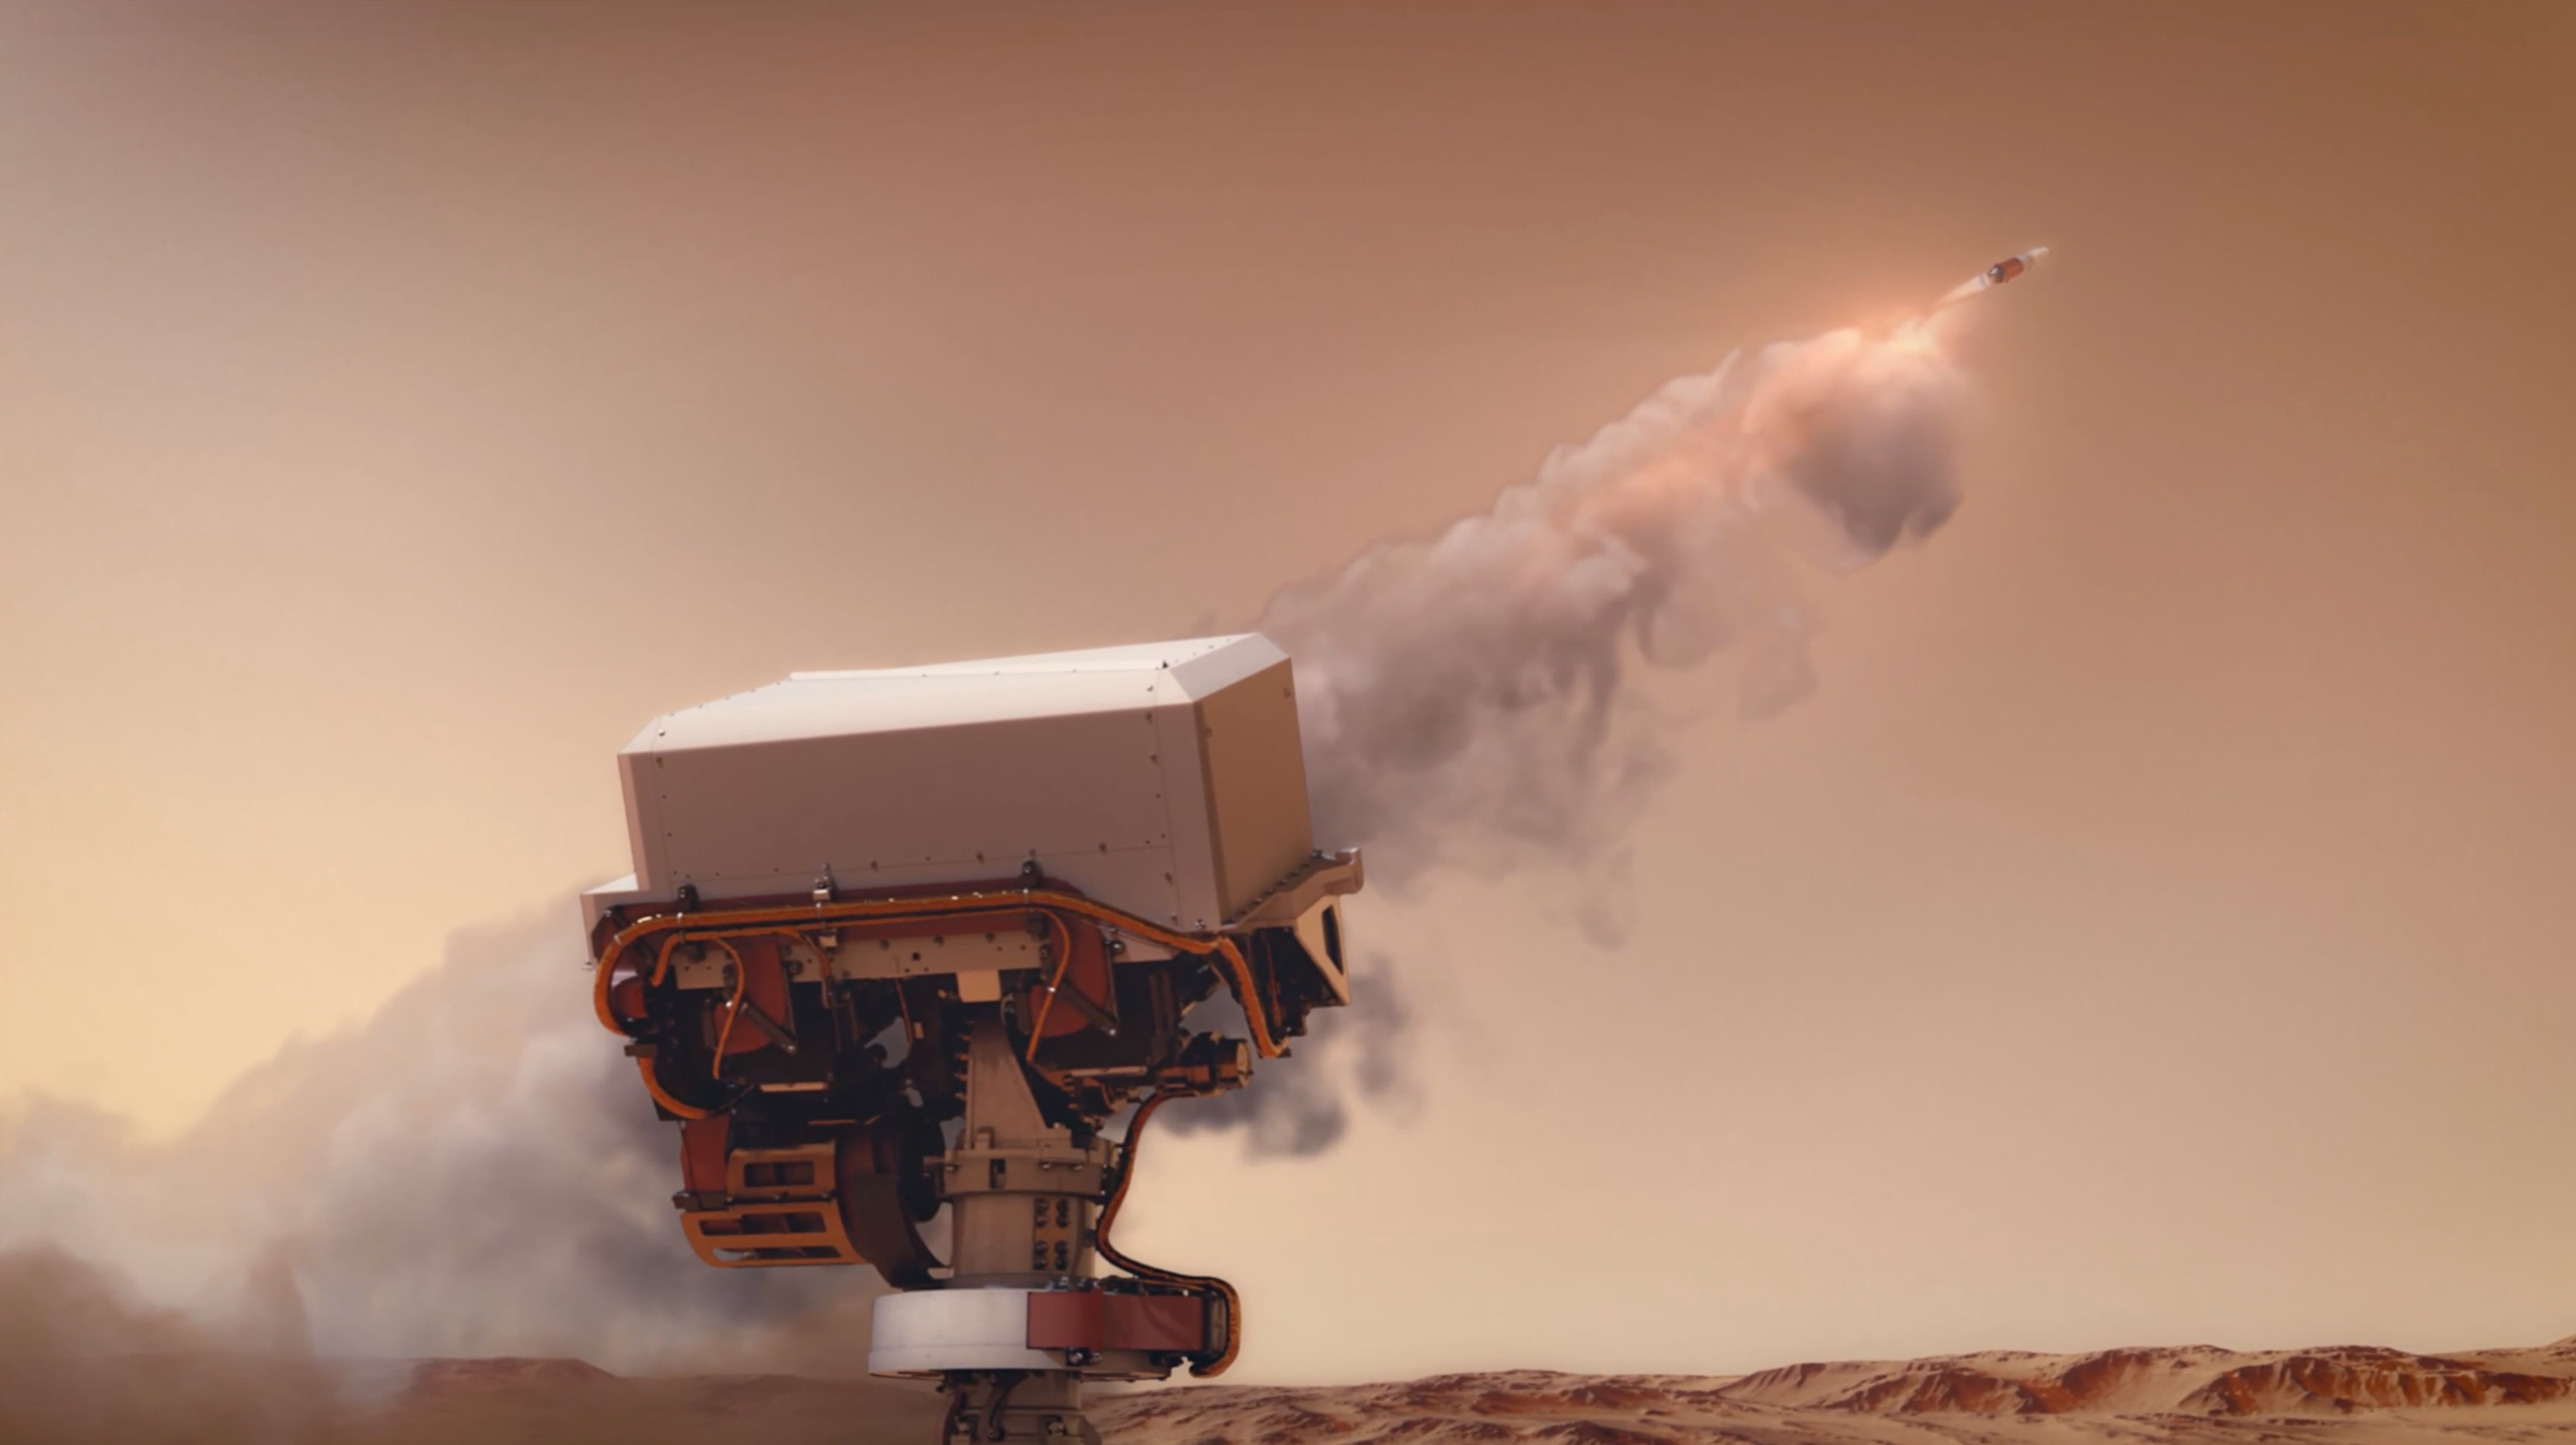
Launch
Target
Objective

Meet InSight
The lander was built on the proven design of NASA's Mars Phoenix lander. InSight's robotic arm was over 5 feet 9 inches (1.8 meters) long. It lifted a seismometer and heat flow probe from the deck and placed them on the surface.
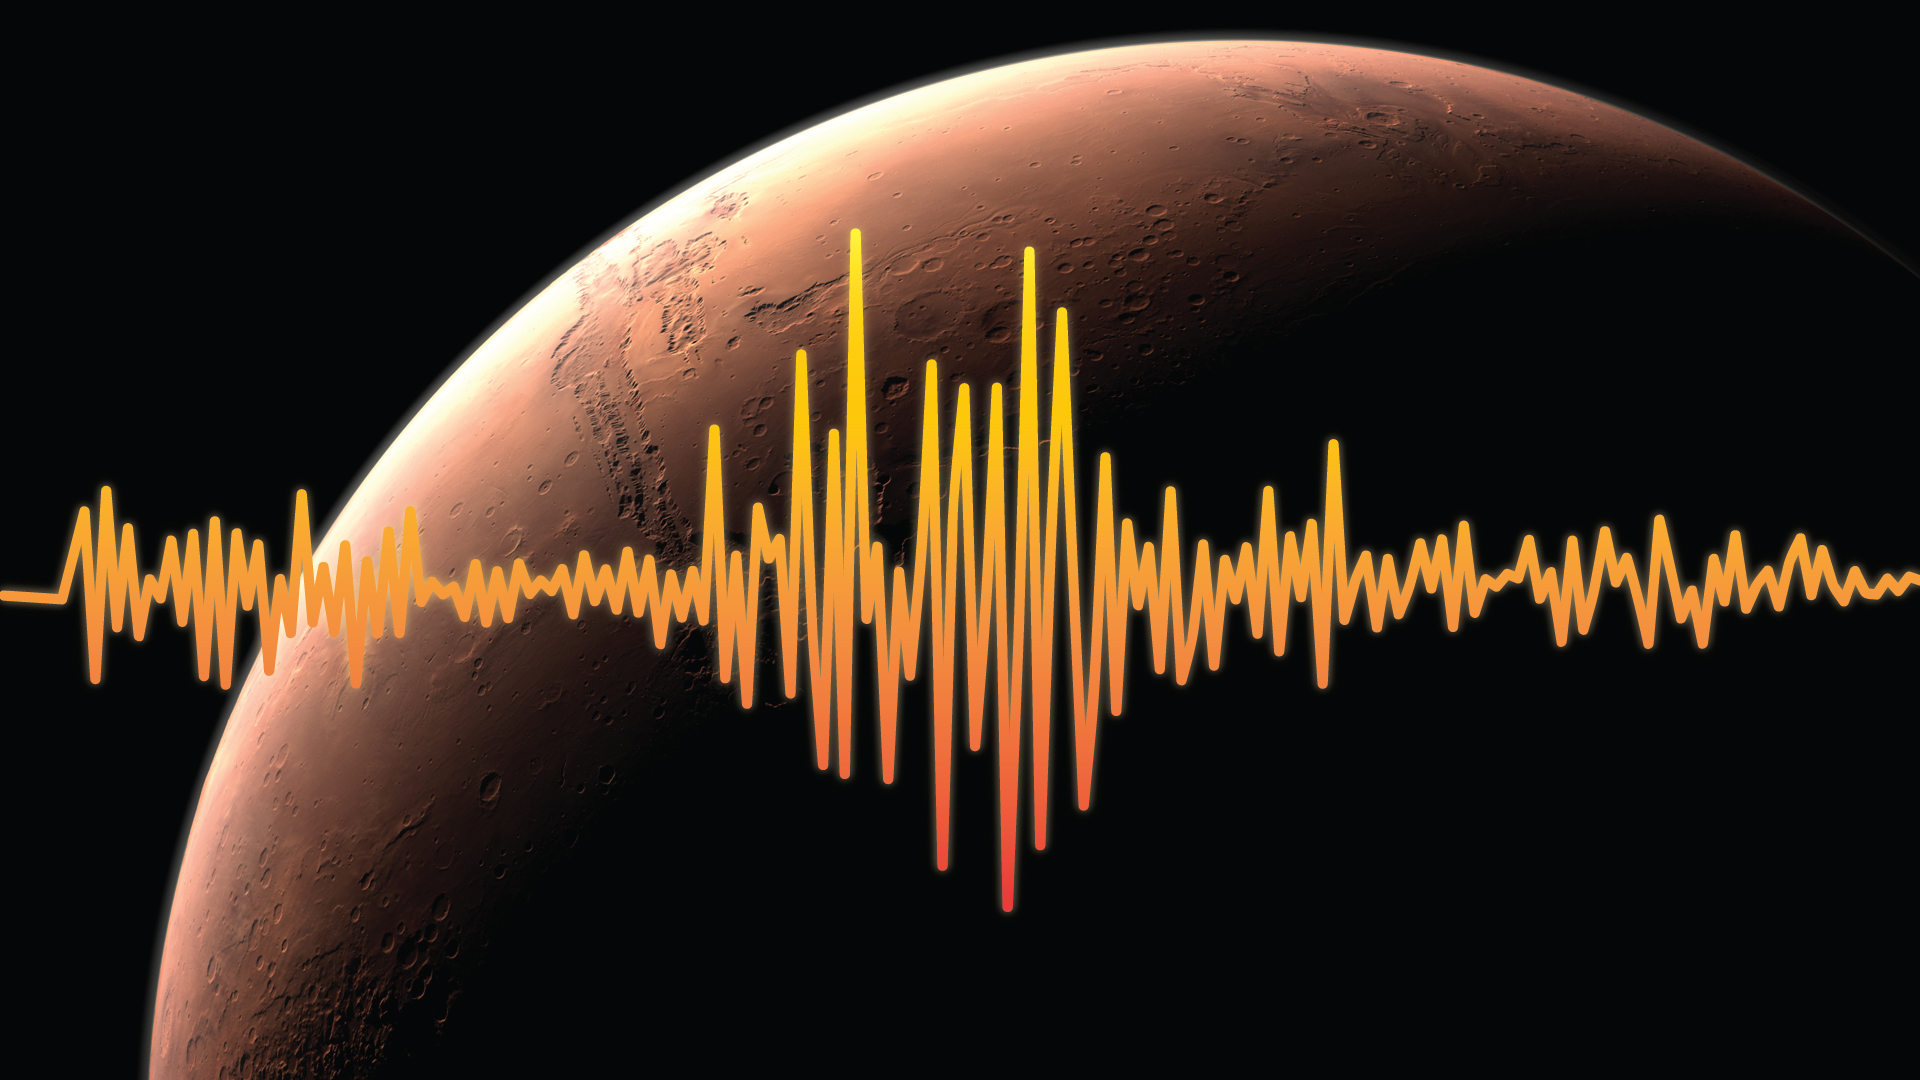
Wind Sounds on Mars
InSight sensors captured a haunting low rumble caused by vibrations from the Martian wind, estimated to be blowing at 10 to 15 mph (5 to 7 meters a second) on Dec. 1, 2018. The winds were consistent with the direction of dust devil streaks in the landing area, which were observed from orbit.
NASA/JPL-Caltech/CNES/IPGP/Imperial College/Cornell
Key Dates
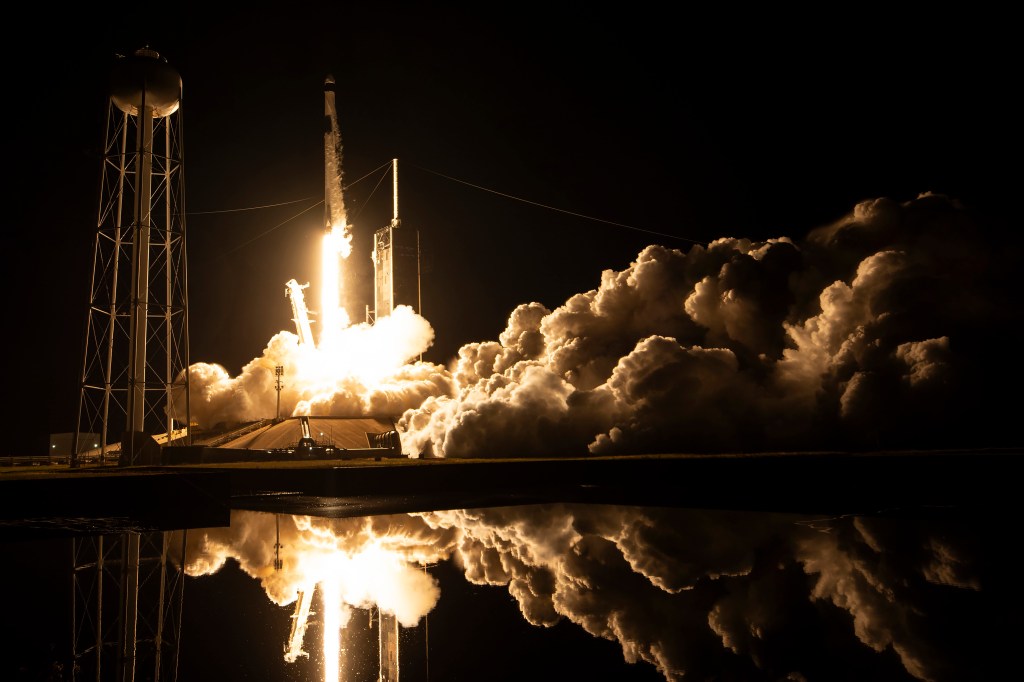
- Launched: May 5, 2018 (4:05 a.m. PT/7:05 a.m. ET)
- Launch Vehicle: Atlas V-401
- Launch Location: Vandenberg Air Force Base, California
- Landed: Nov. 26, 2018, at 11:52:59 a.m. PT (2:52:59 p.m. ET)
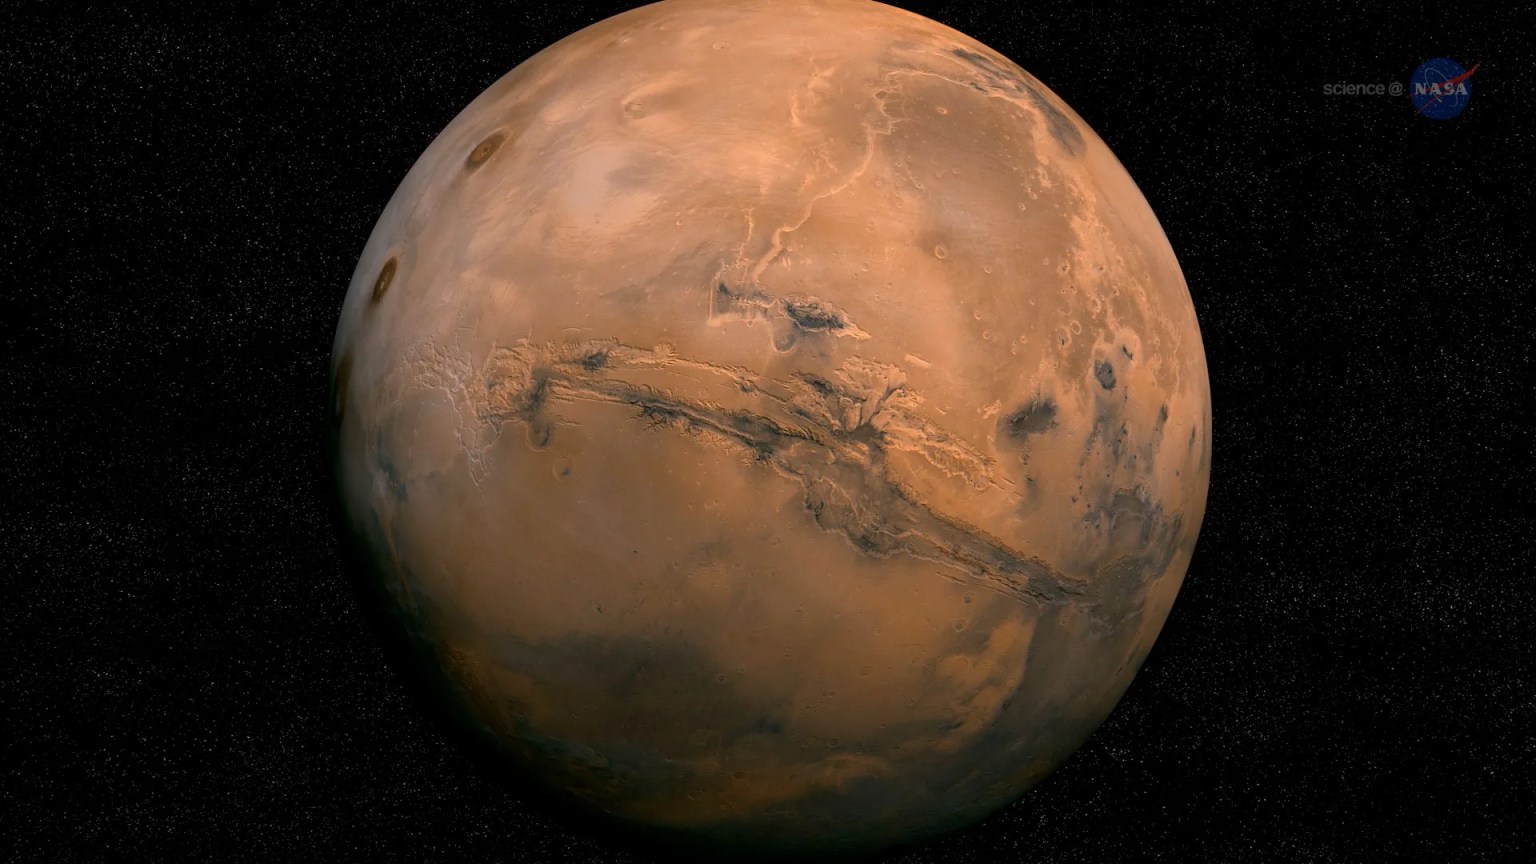
- Landing Site: Elysium Planitia, Mars
- End of Mission: Dec. 15, 2022
Read More
-
Objective
The InSight mission had two major goals, each with several science investigations, designed to help uncover the process that shaped all of the rocky planets in the inner solar system.
-
Science
InSight studied the deep interior of Mars and was designed to take the planet's vital signs: its pulse, temperature, and reflexes.
-
-
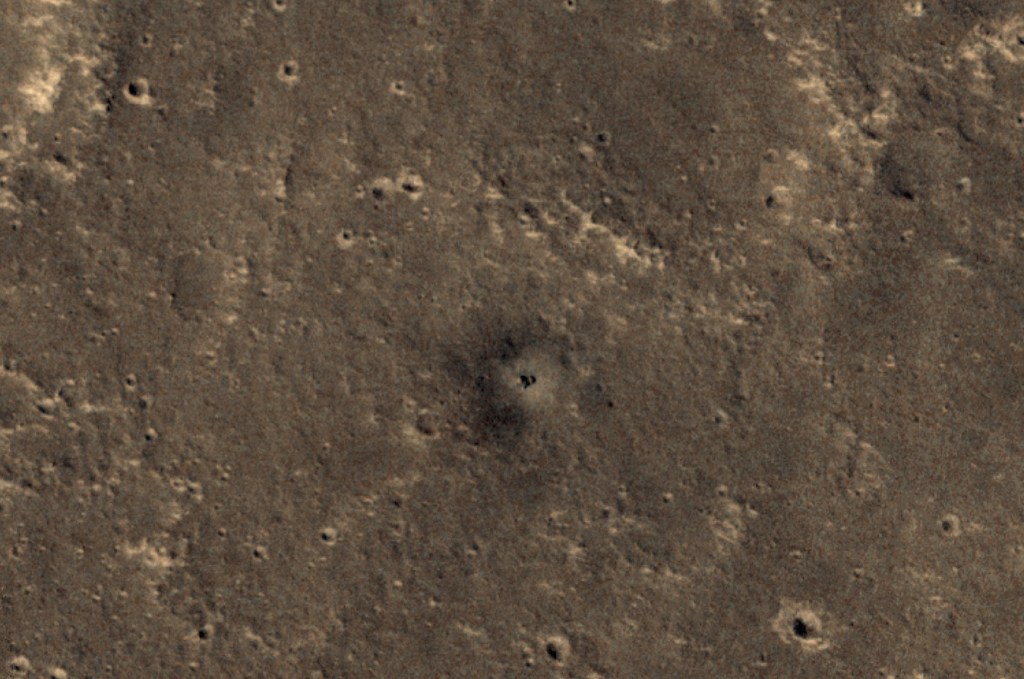
Landing Site
-
Elysium Planitia
InSight landed near Mars' equator on the western side of a flat, smooth plain called Elysium Planitia. Elysium Planitia was selected not for its surface features, but for safety considerations. InSight's purpose was to study the interior of Mars, not the surface. Thus, in the selection of a landing site, what's on the surface mattered less than for previous rover missions focused on the geology.
Planitia is Latin for a flat surface, geometric plane, or flatness or a plain. Elysium is from the ancient Greek name for an afterlife paradise, usually referred to in English as the Elysian Fields. The landing site lies in the western portion of Elysium Planitia, centered at about 4.5 degrees north latitude and 135.9 degrees east longitude. This is just 373 miles (600 kilometers) from Curiosity’s landing site, Gale Crater.
Image Caption: The red dot marks the final landing location of NASA's InSight lander in this annotated image of the surface of Mars, taken by the THEMIS camera on NASA's 2001 Mars Odyssey orbiter in 2015. Credit: NASA/JPL-Caltech/ASU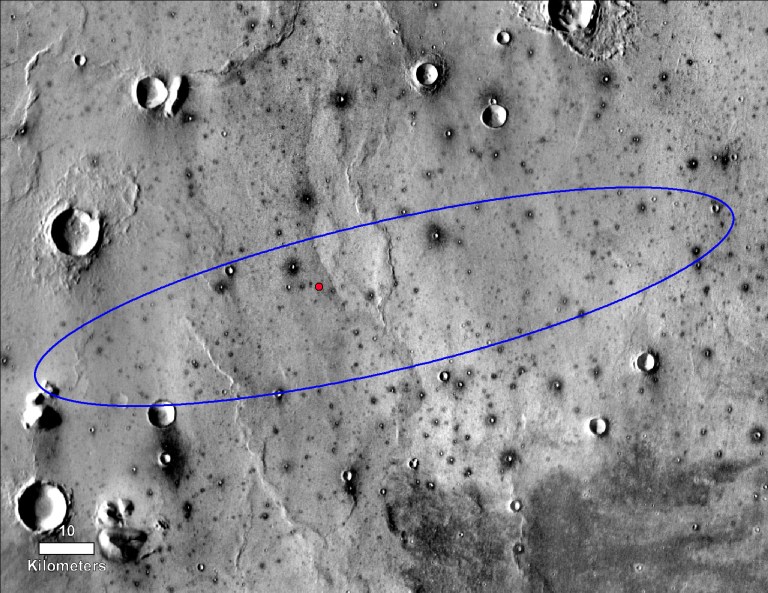 The red dot marks the final landing location of NASA's InSight lander in this annotated image of the surface of Mars, taken by the THEMIS camera on NASA's 2001 Mars Odyssey orbiter in 2015.NASA/JPL-Caltech/ASU
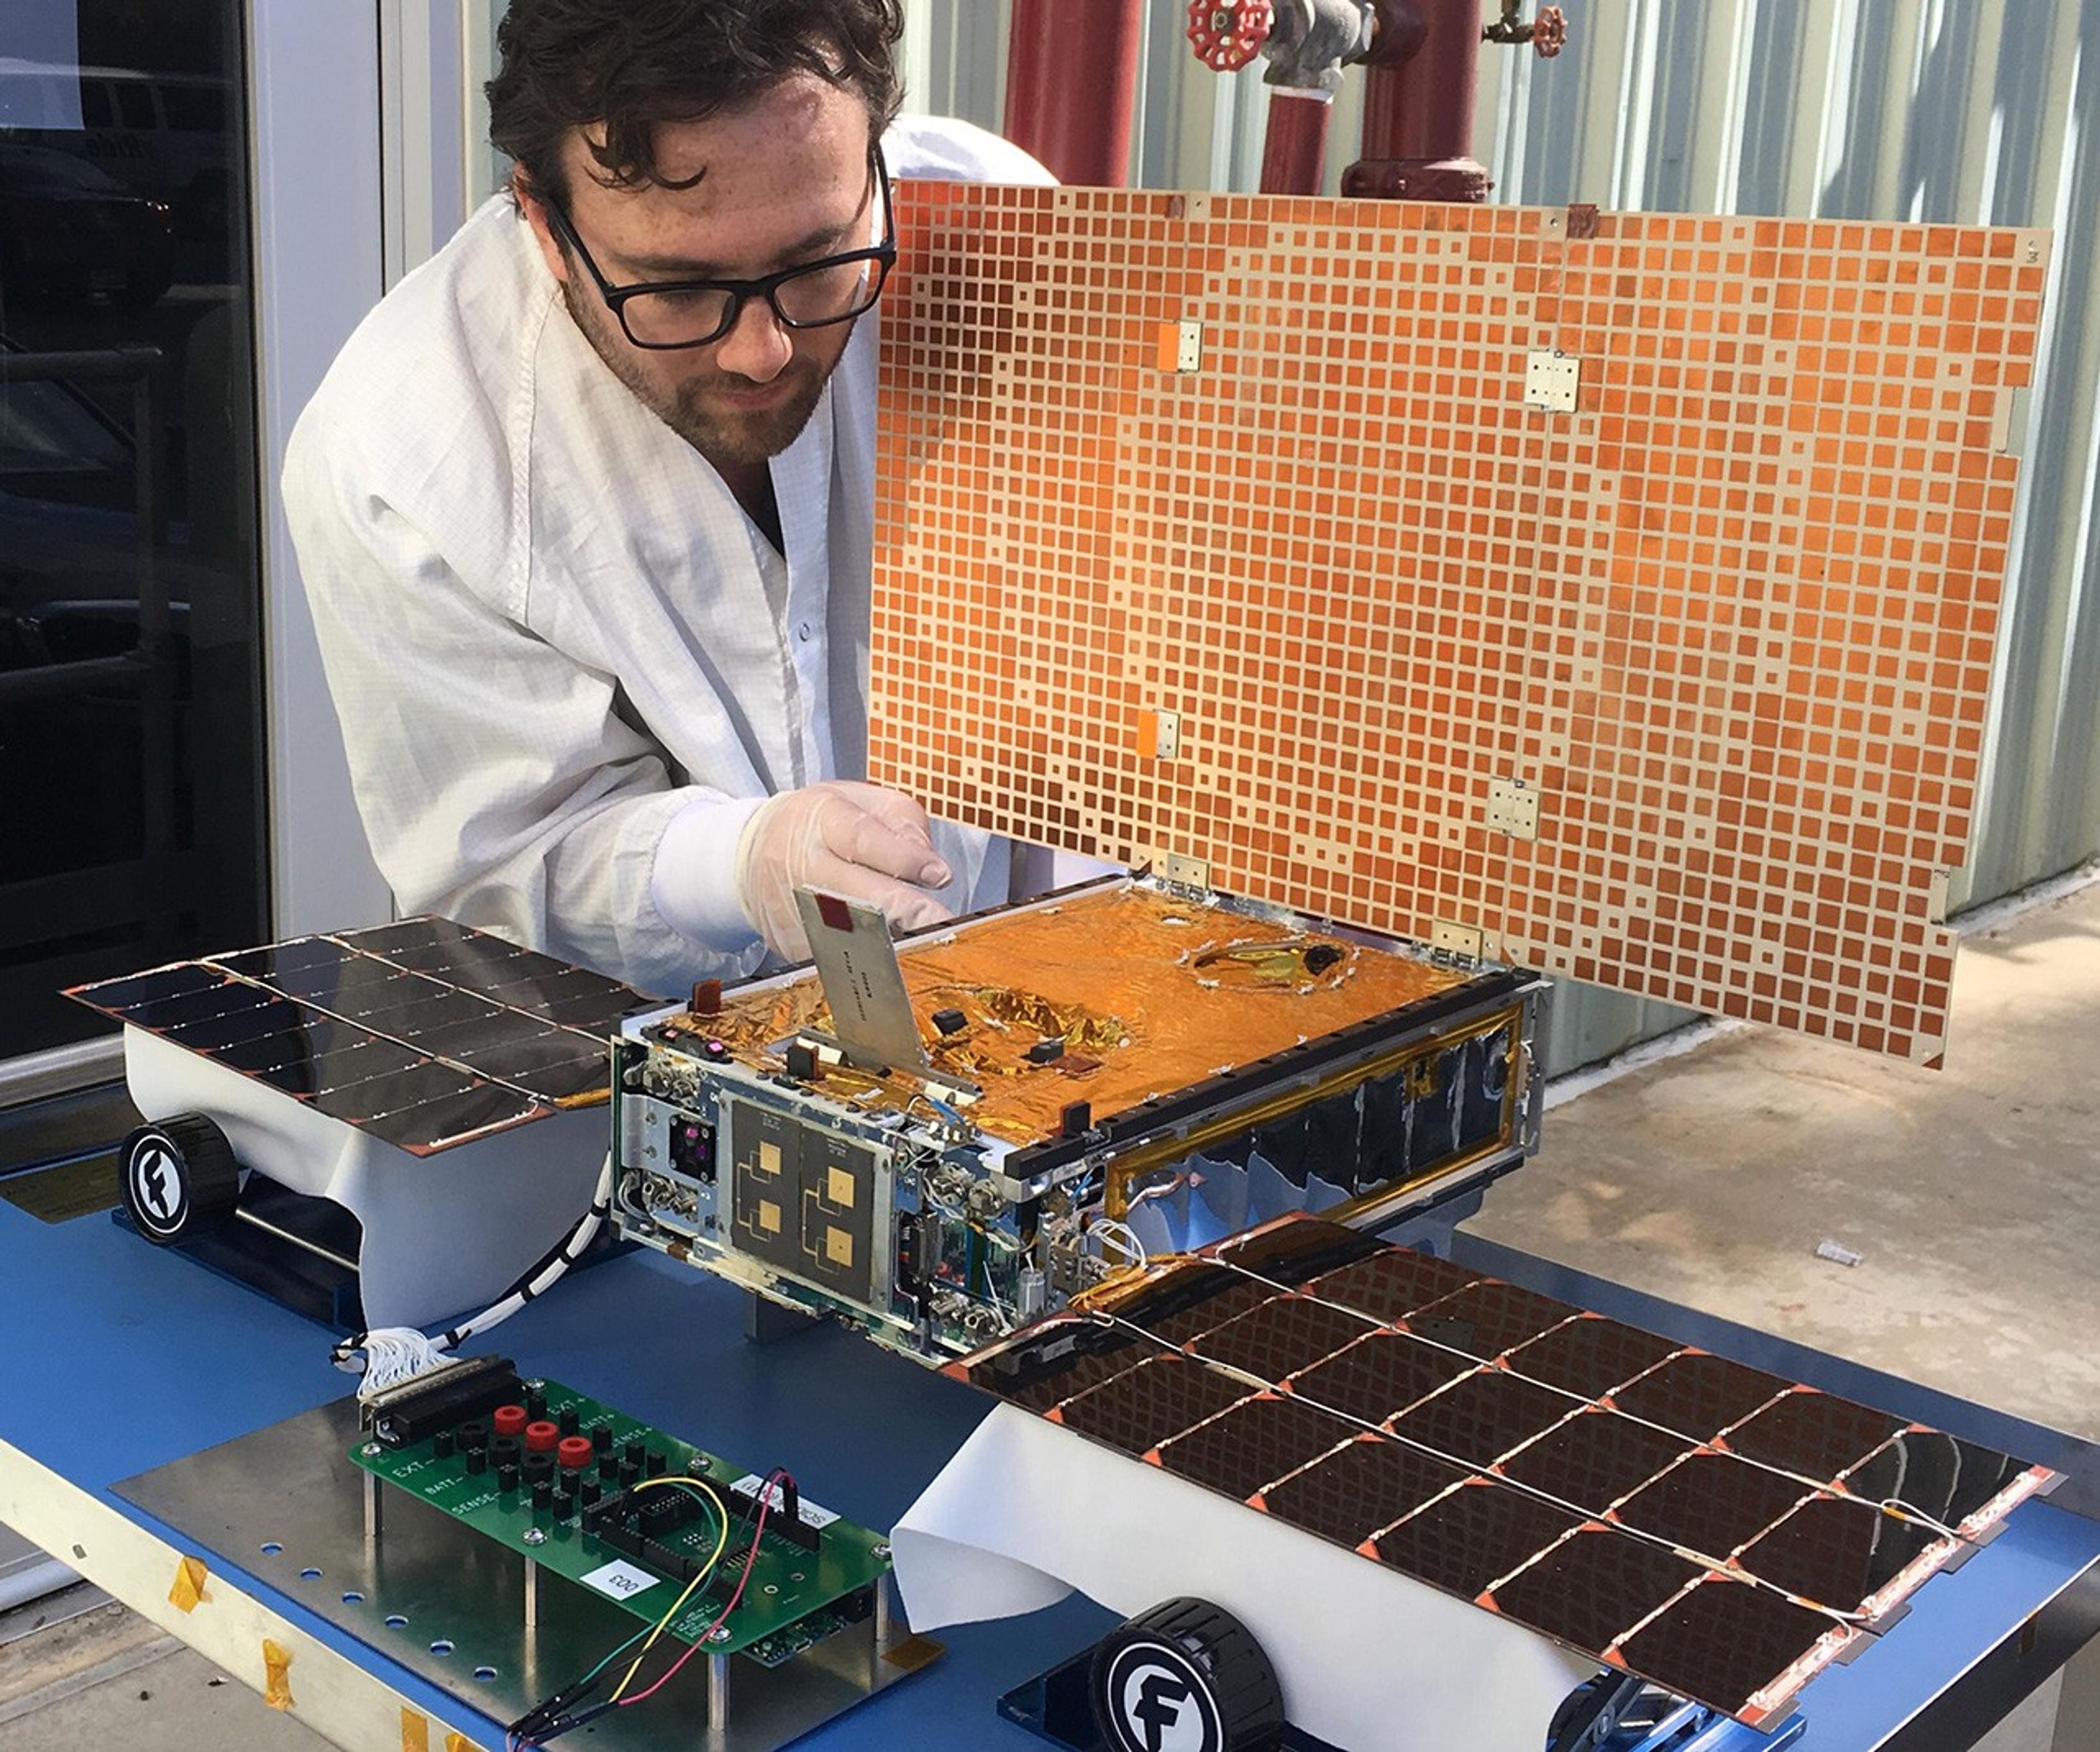
Mars Cube One: The First Interplanetary Cubesats
The rocket that launched InSight also launched a separate NASA technology experiment: two mini-spacecraft called Mars Cube One, or MarCO. These briefcase-sized CubeSats flew on their own path to Mars behind InSight.
Learn More