MAVEN Maps Wind in the Martian Upper Atmosphere

December 12, 2019
| Credit | NASA Goddard/MAVEN/SVS/Greg Shirah |
|---|---|
| Language |
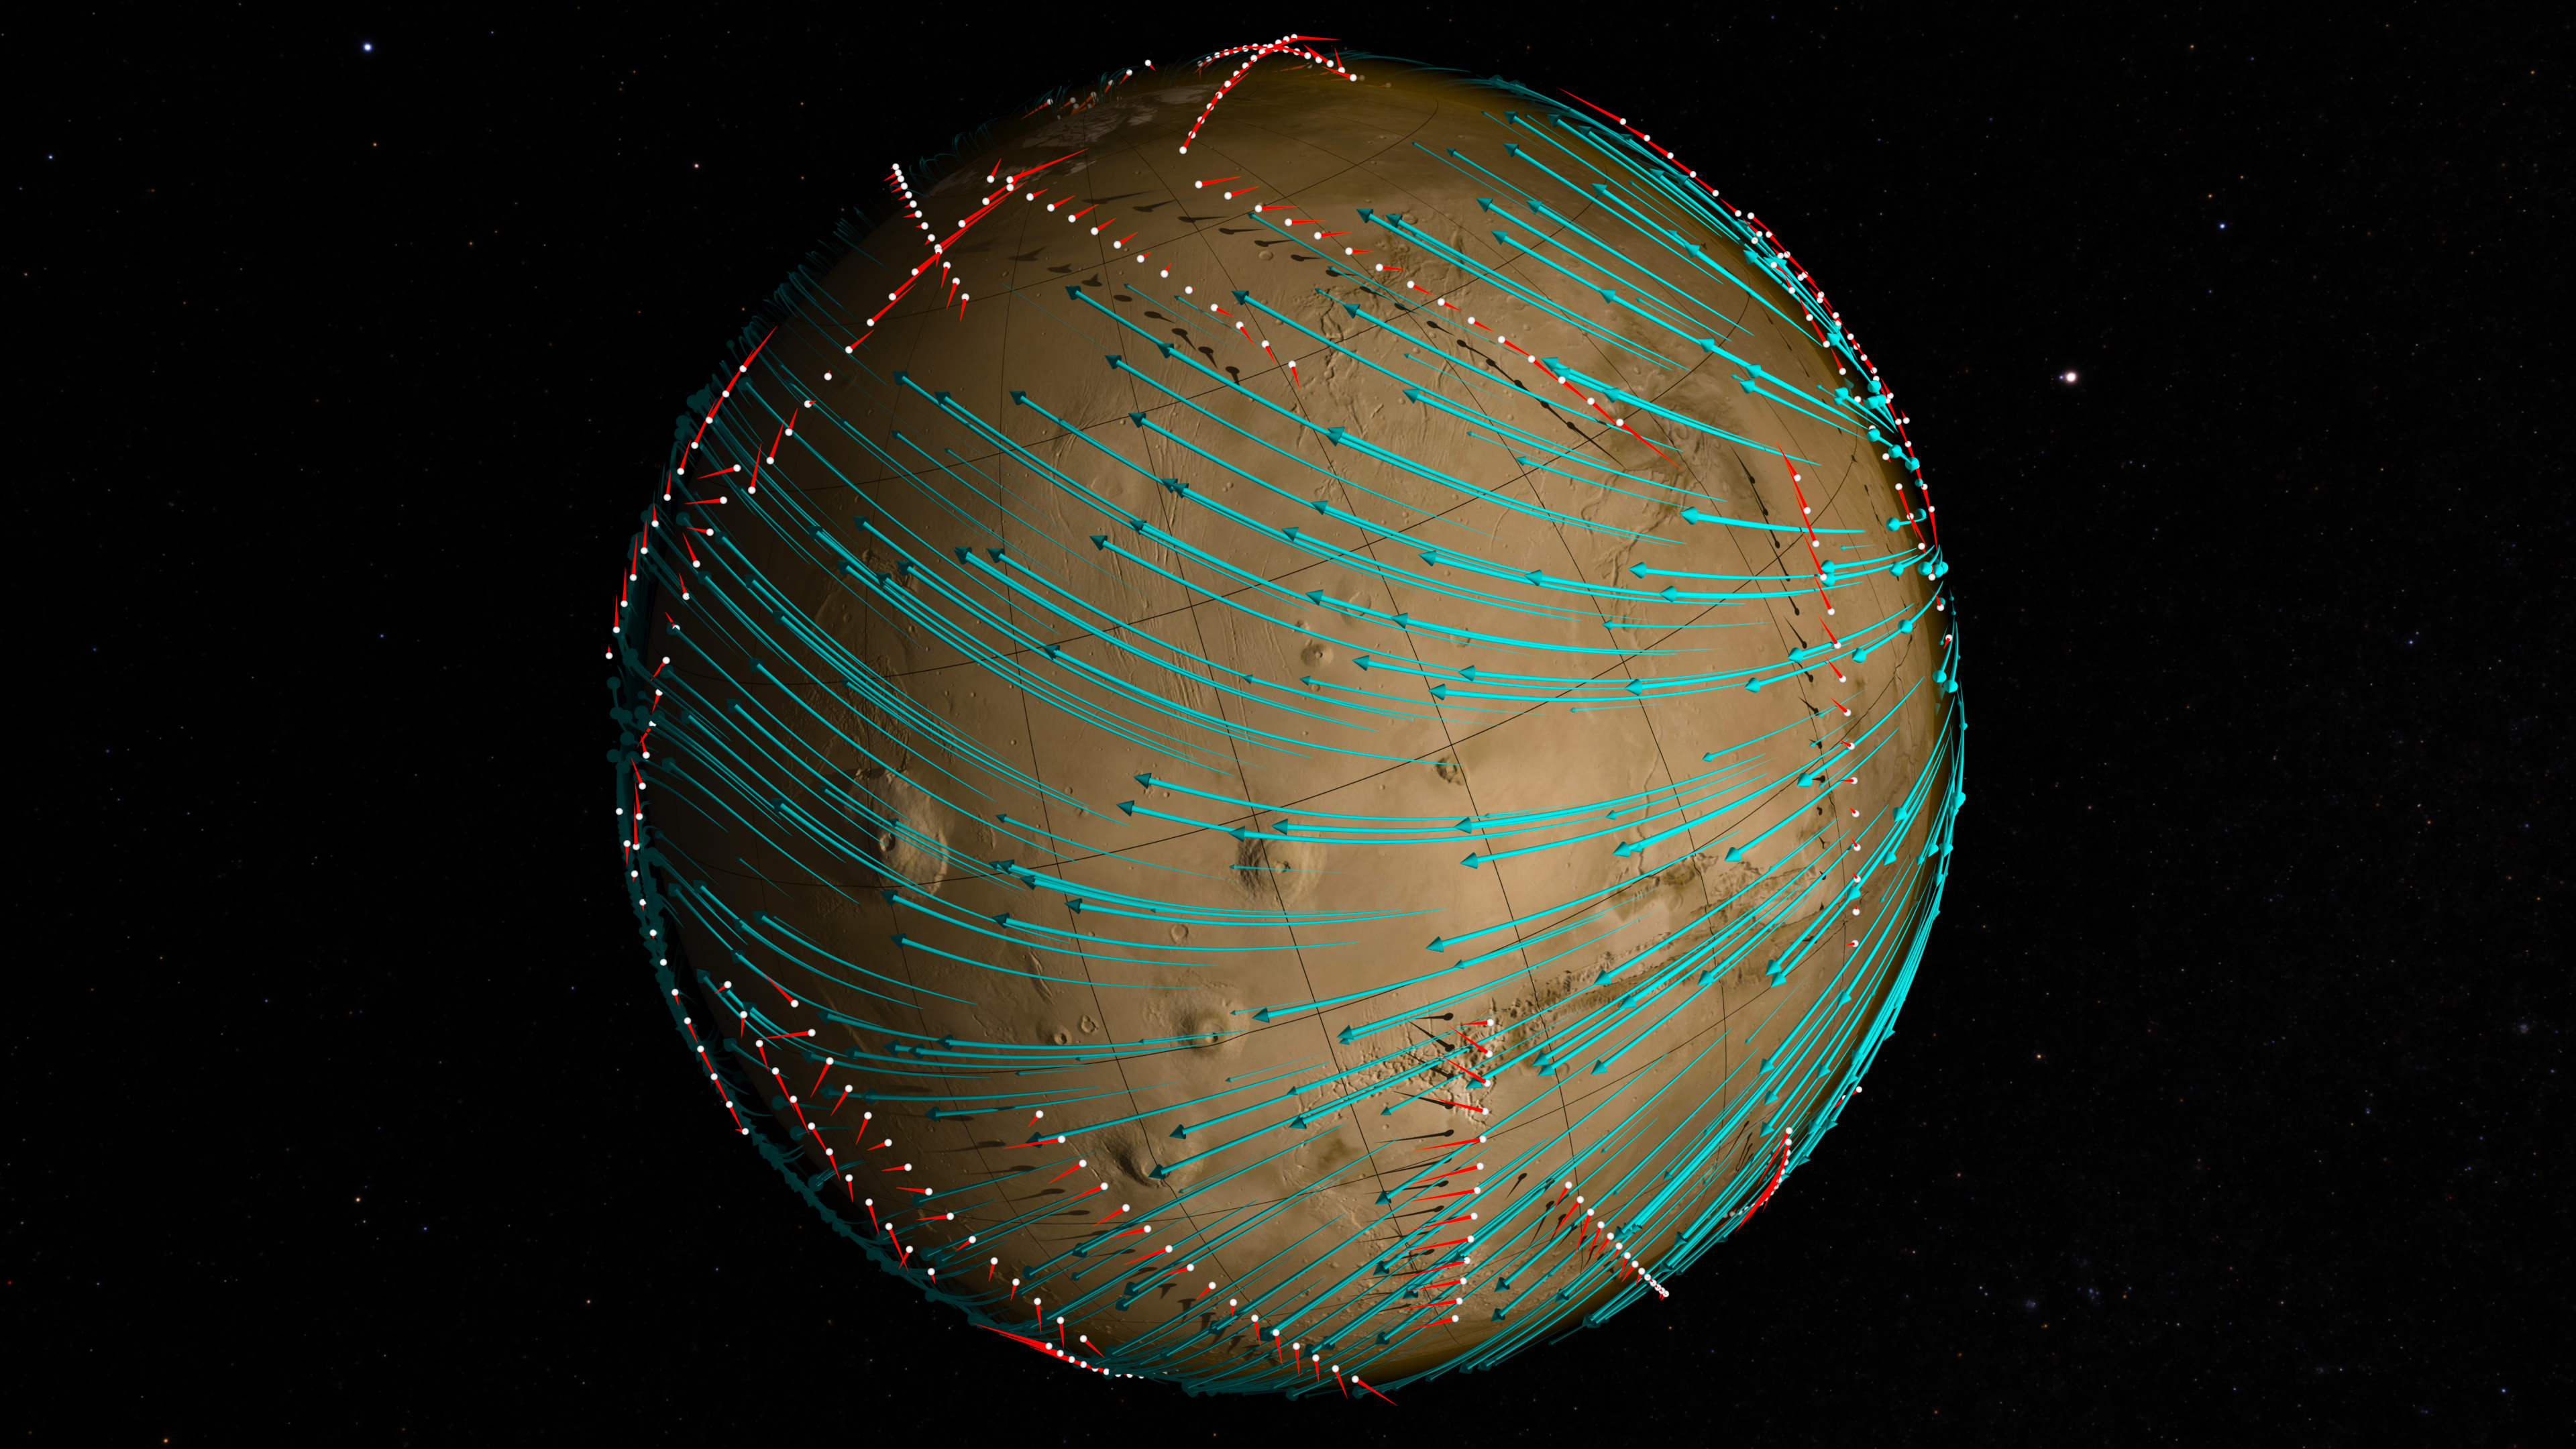
|
Computer-generated visualization of the orbital paths (white dots) taken by the MAVEN spacecraft as it mapped winds (blue lines) in the Martian upper atmosphere. Red lines coming from the white dots represent local wind speed and direction, measured by MAVEN’s Neutral Gas and Ion Mass Spectrometer instrument.

